The Lists component manages data as a table, like a spreadsheet: typed columns, saved views, filters, sorting, grouping and formulas.
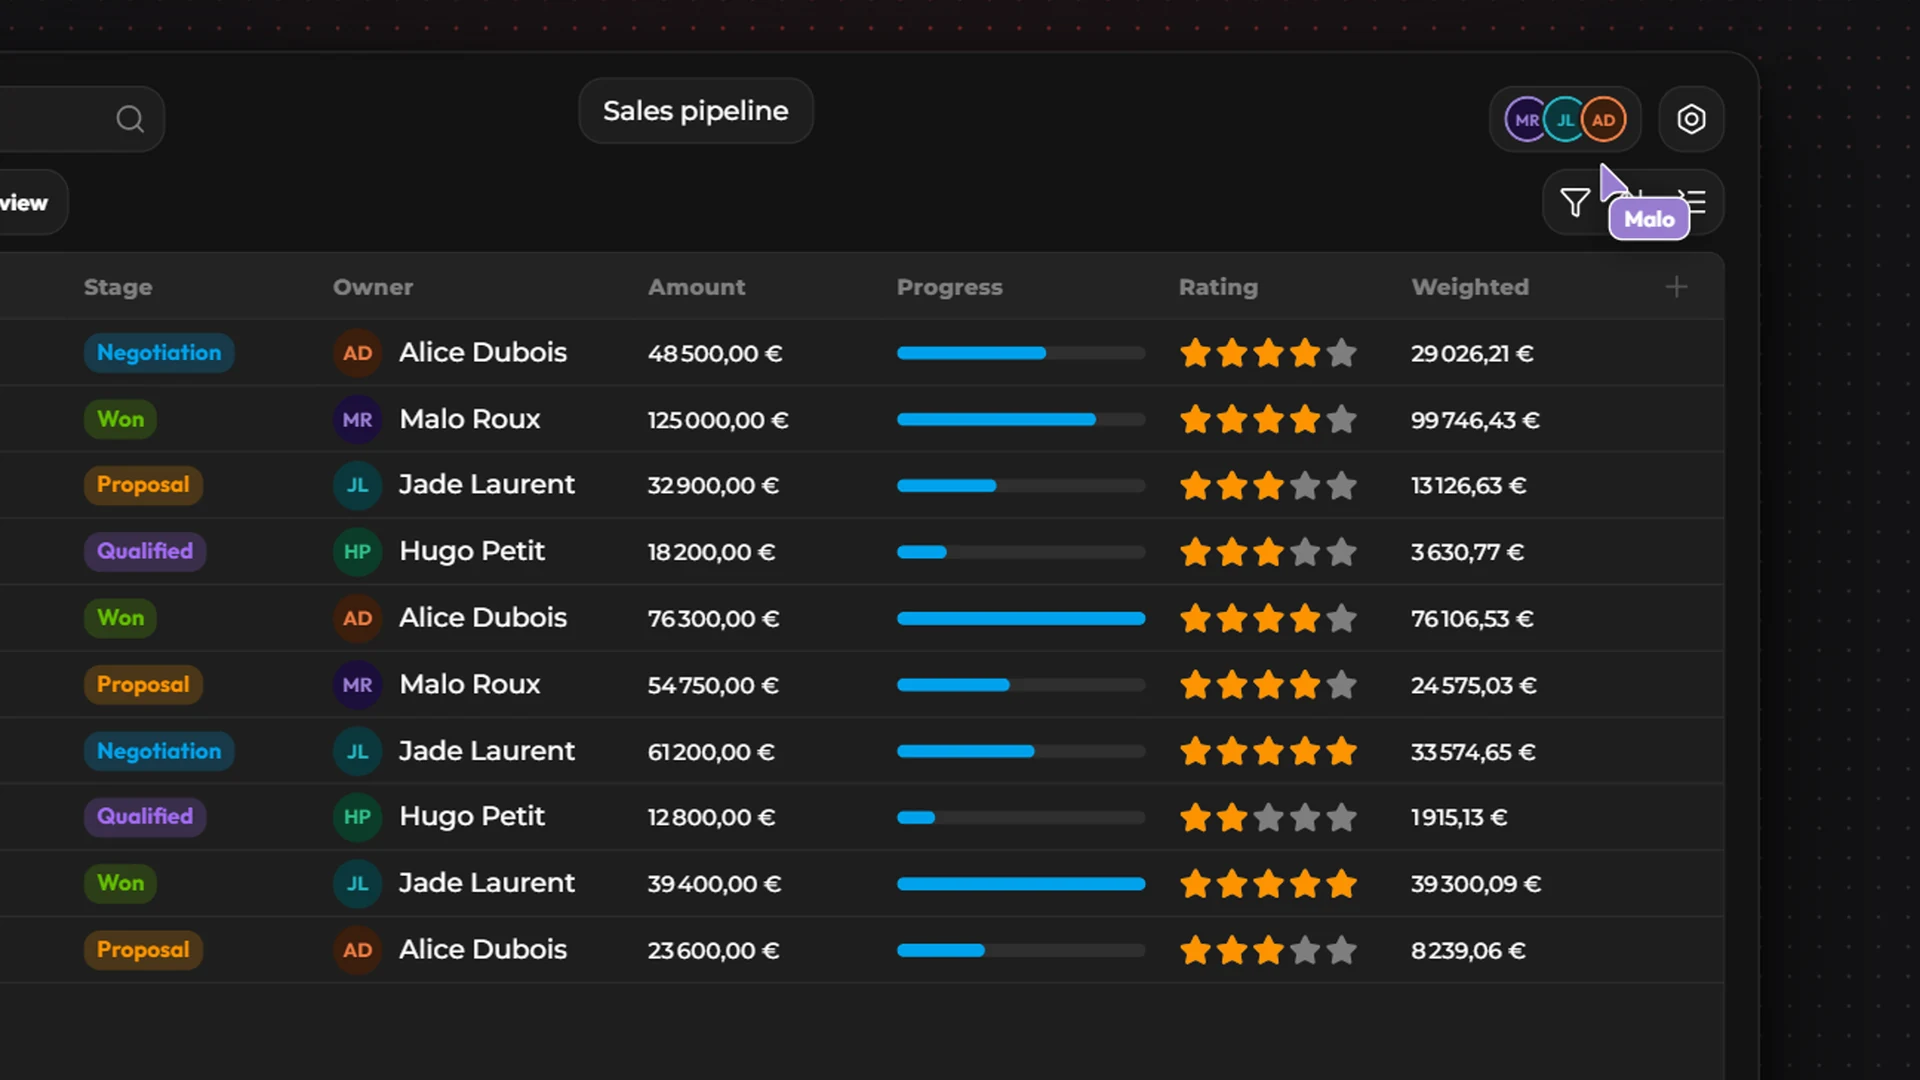
The interface
The toolbar
With the mouse
Click a row: selects it.
Double-click: opens it for editing, in a modal or a side panel depending on your settings.
Right-click a row: Copy, Edit, Select, Select all, Delete item.
Right-click a column header: Column settings, Freeze up to this column, Unfreeze columns.
Double-click a header's edge: fits the column width.
Columns
Configuration › Columns › Add column. Pick a name, a type, then the Data Binding (the source field it shows) or Create data field.
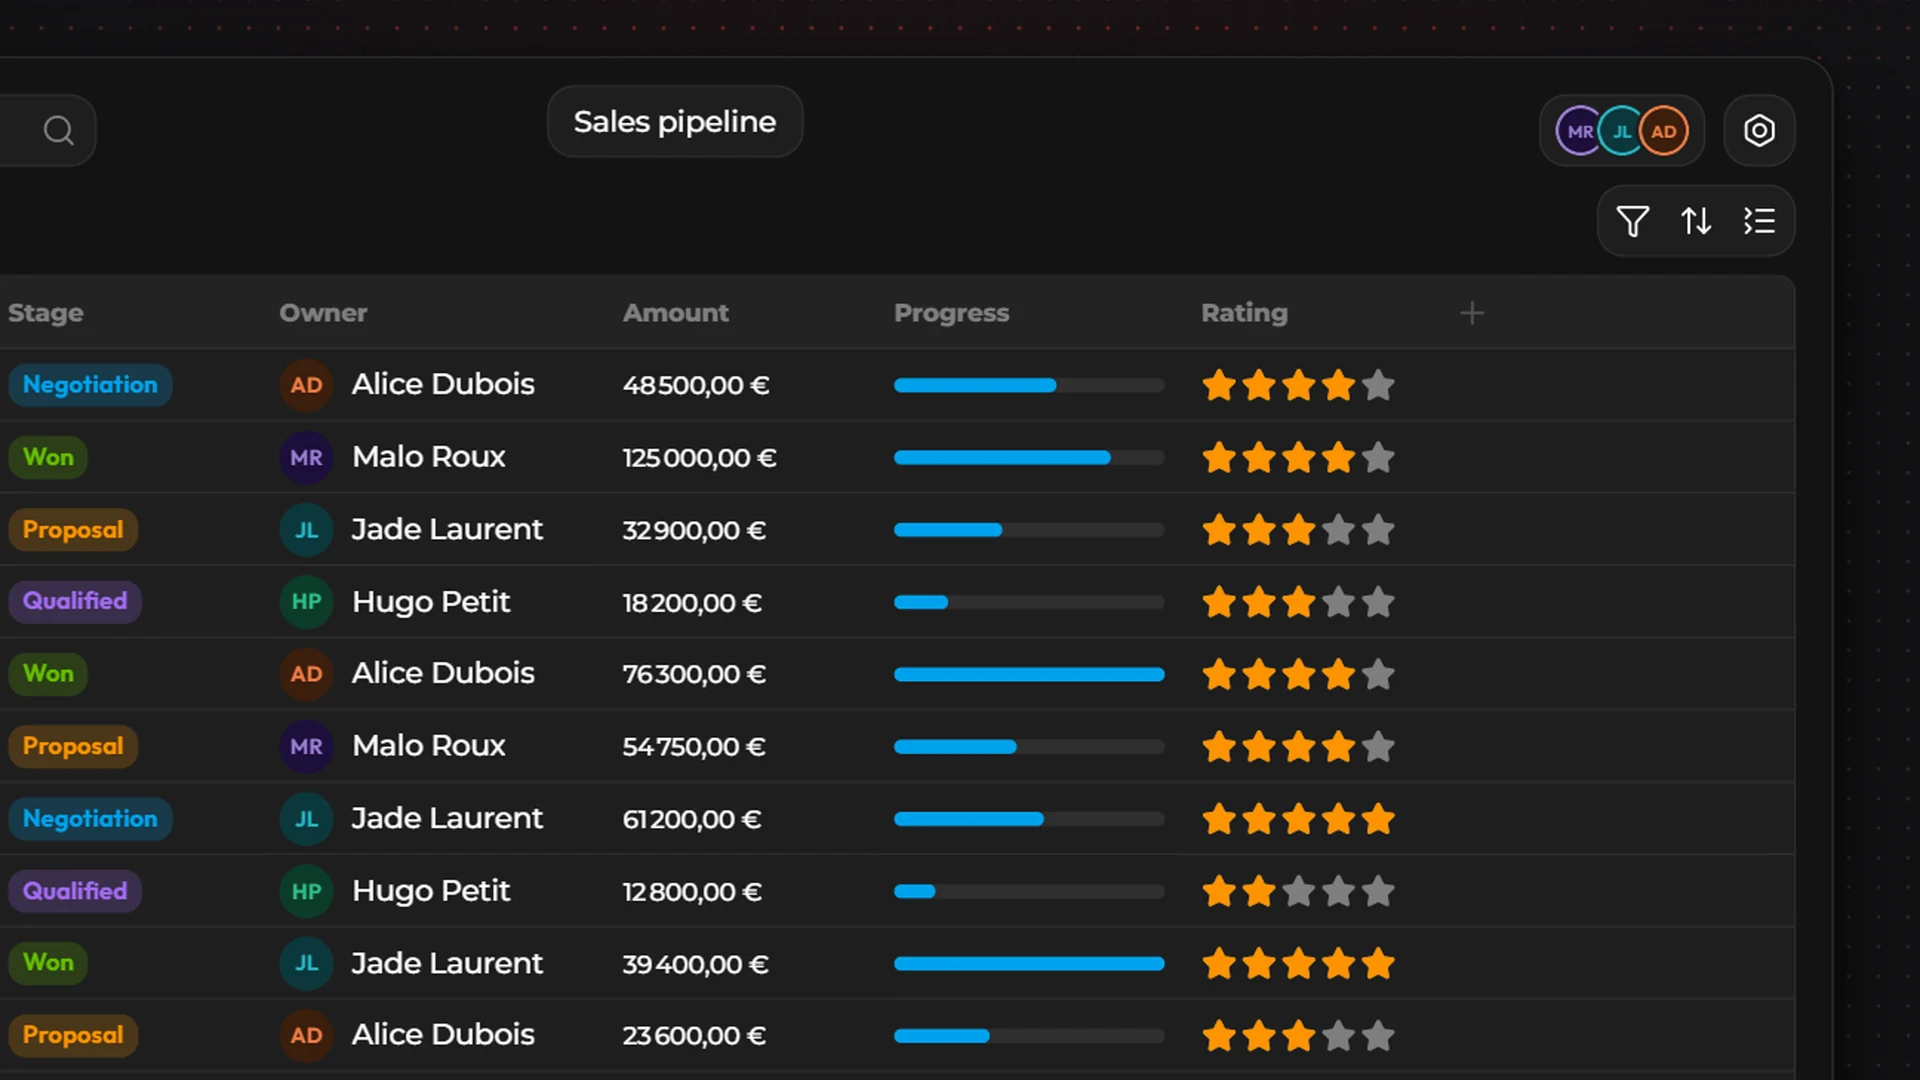
The 15 types
Column options
Visible, Sortable, Searchable, Filterable, Groupable, Required, Show Label, Show Tooltip, Truncate, Alignment, and a Formatting section suited to the type (date format, locale, currency, decimals, image size, color gradient…).
Sync from data creates the columns automatically from the source's fields (see Connectors).
Formulas
A column can be computed from numeric columns: Formula card in the column settings.
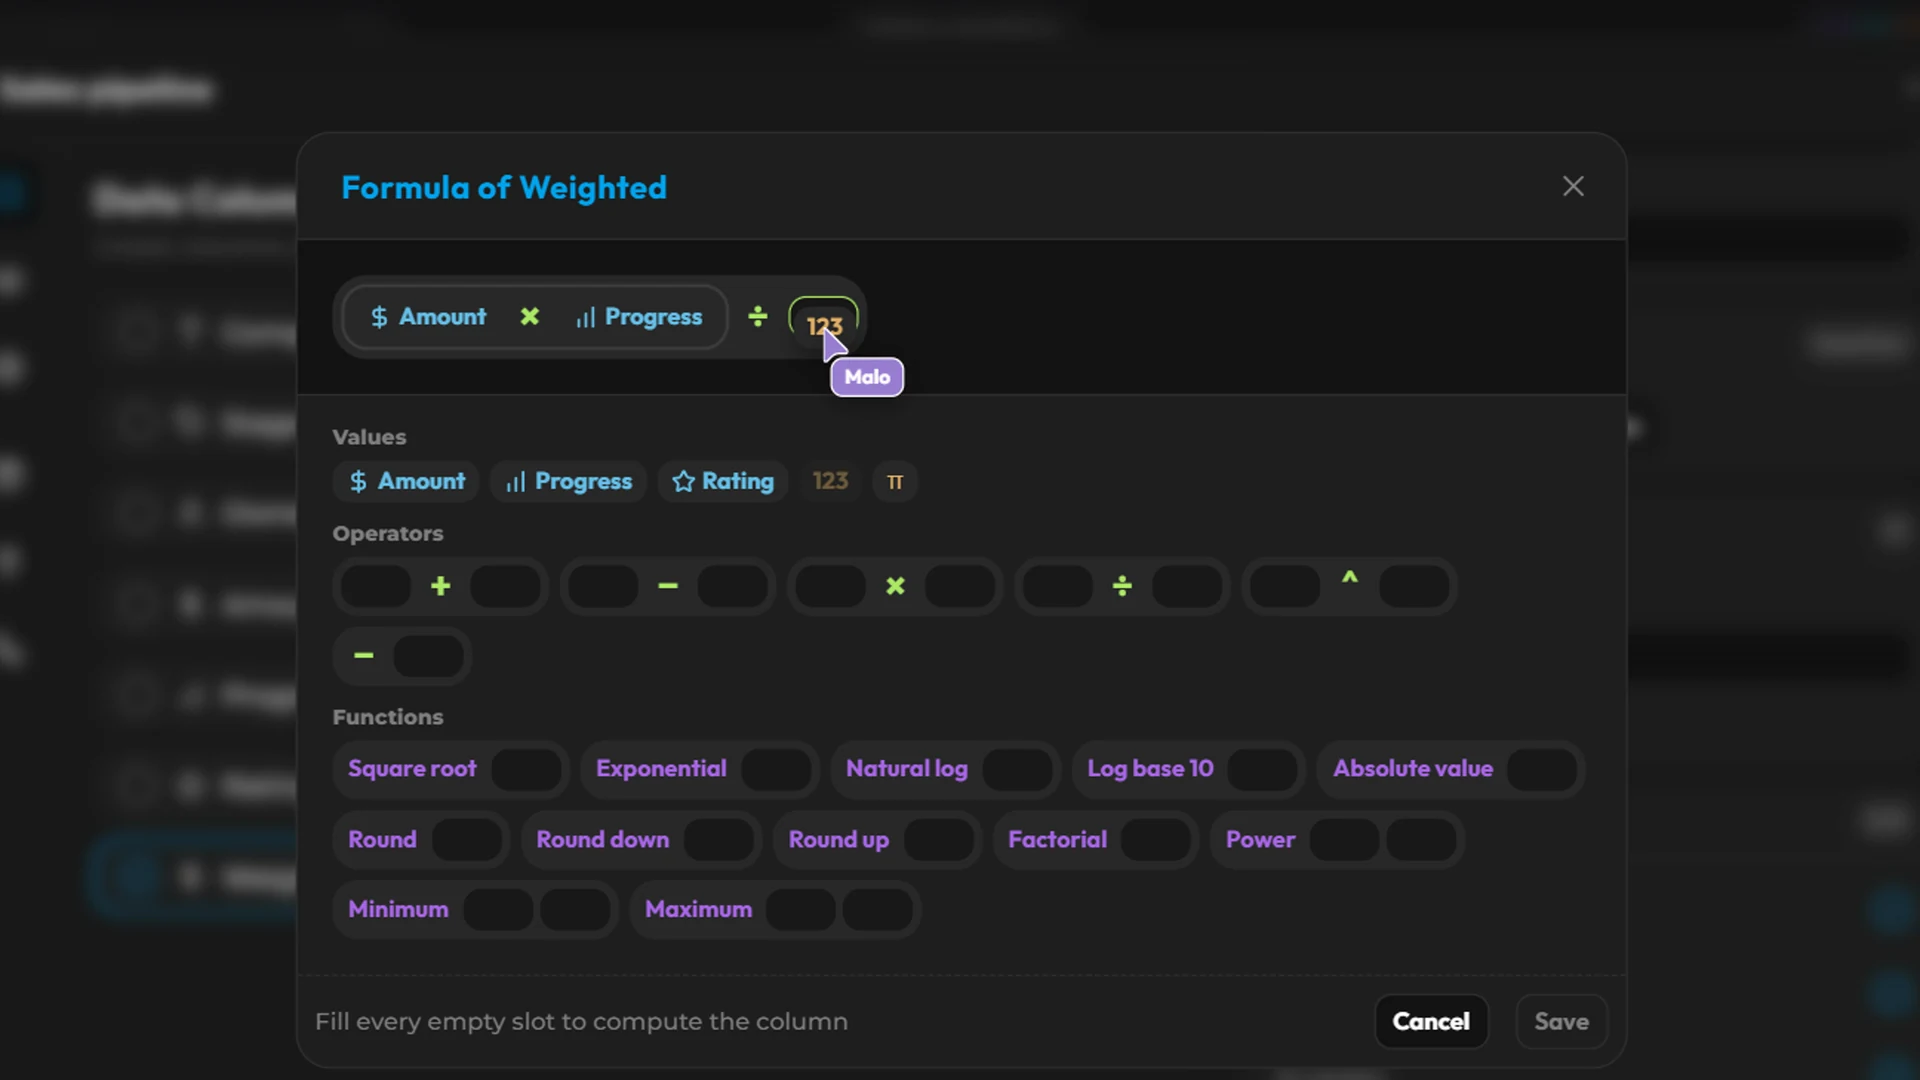
Operators:
+ − × / ^Functions: square root, exponential, natural and base-10 logarithm, absolute value, round, floor and ceiling, factorial, power, minimum, maximum
Constant:
piThe editor works with draggable blocks. Ctrl+Z / Ctrl+Y undo and redo.
Filter, sort, group
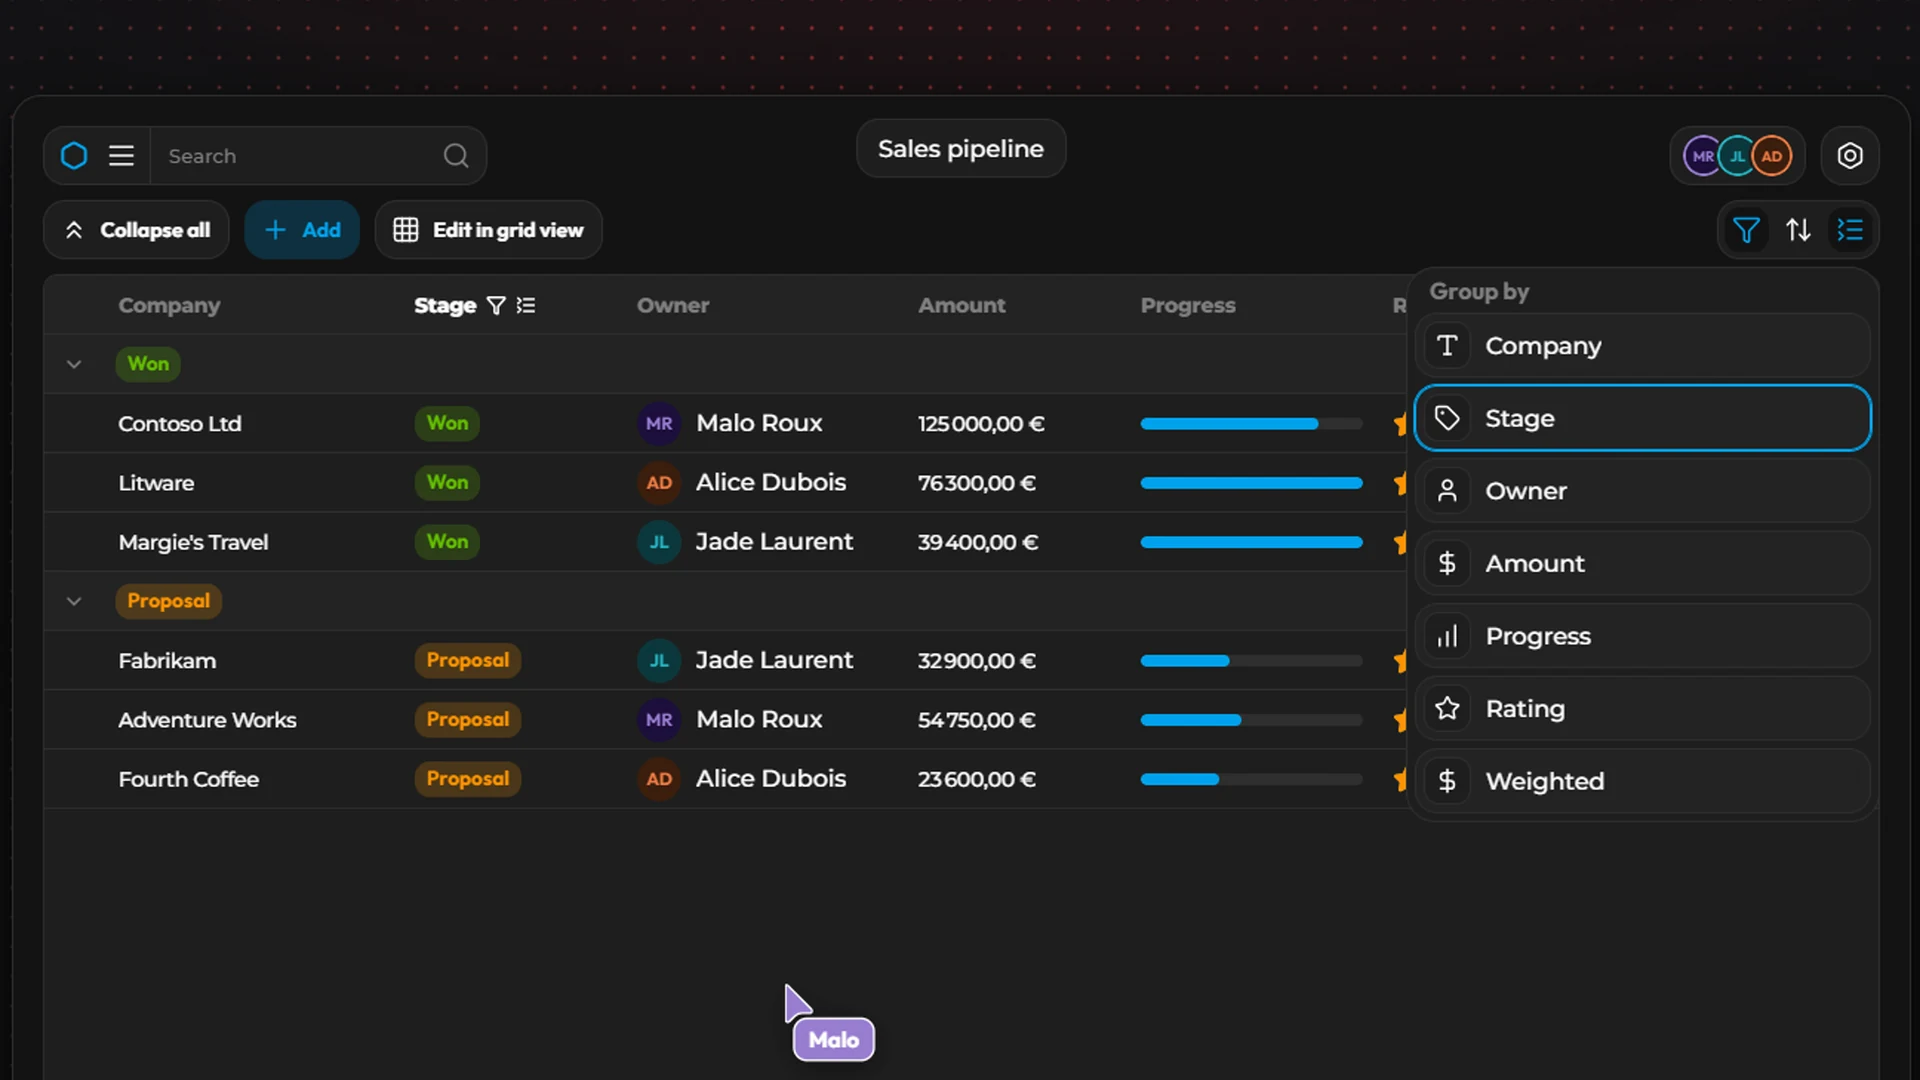
Filter: in Simple mode, tick values or give a range (Min/Max, From/To). In Advanced mode, combine conditions: equals, contains, starts with, ends with, greater than, less than, is empty, is not empty…
Sort: on several levels.
Shift + click on a header adds a level.Group: on several levels (“Group by”, “Then by”).
Views
A view remembers the columns shown, the sort, the filters and the grouping. Create as many as you need: “Active customers”, “By city”, “To follow up”.
Configuration › Views › Add View.
Configure columns to show.
Set Default Sort, Default Filters, Default Grouping.
Tick Force sort, Force filters or Force grouping so readers cannot change them.
Frozen columns: freeze the first columns when scrolling.
Right-click a view's icon: Rename, Set as default, Delete.
Adding data
Add: opens the form for a new row.
Paste from Excel: copy a range in your spreadsheet, then
Ctrl+V in the list (outside a field). Kubme opens Paste from clipboard: match the columns, check the preview, and tick The first row holds the column names if needed.Import a file: Menu › Import / Export › Data only (CSV, JSON, XML, YAML), see Overview.
Plug in an API: add a connector to the list, see Multi-source.
With Kubme AI
Ask Kubme AI: “Add a Status column (To follow up, In progress, Won) to my Customers list, and a ‘To follow up’ view filtered on that status.”
Settings
Configuration › Settings:
Editing: Enable grid editing and Modal or Side panel edit mode;
Selection: Single or Multiple;
Connector: Reset connector (erases all data).